Free Income Statement Template: Interactive Revenue, Expense & Profitability Analysis Dashboard
Free income statement template with interactive revenue, expense & profitability analysis. Track financial performance with a ready-to-use dashboard.

Similar Templates


What Is an Income Statement Template?
An income statement template is a pre-built financial document that organizes your revenue, expenses, and net income into a clear, readable format. Also known as a profit and loss (P&L) statement, it shows how money flows through a business over a specific period — helping stakeholders quickly assess whether the company is profitable or operating at a loss.
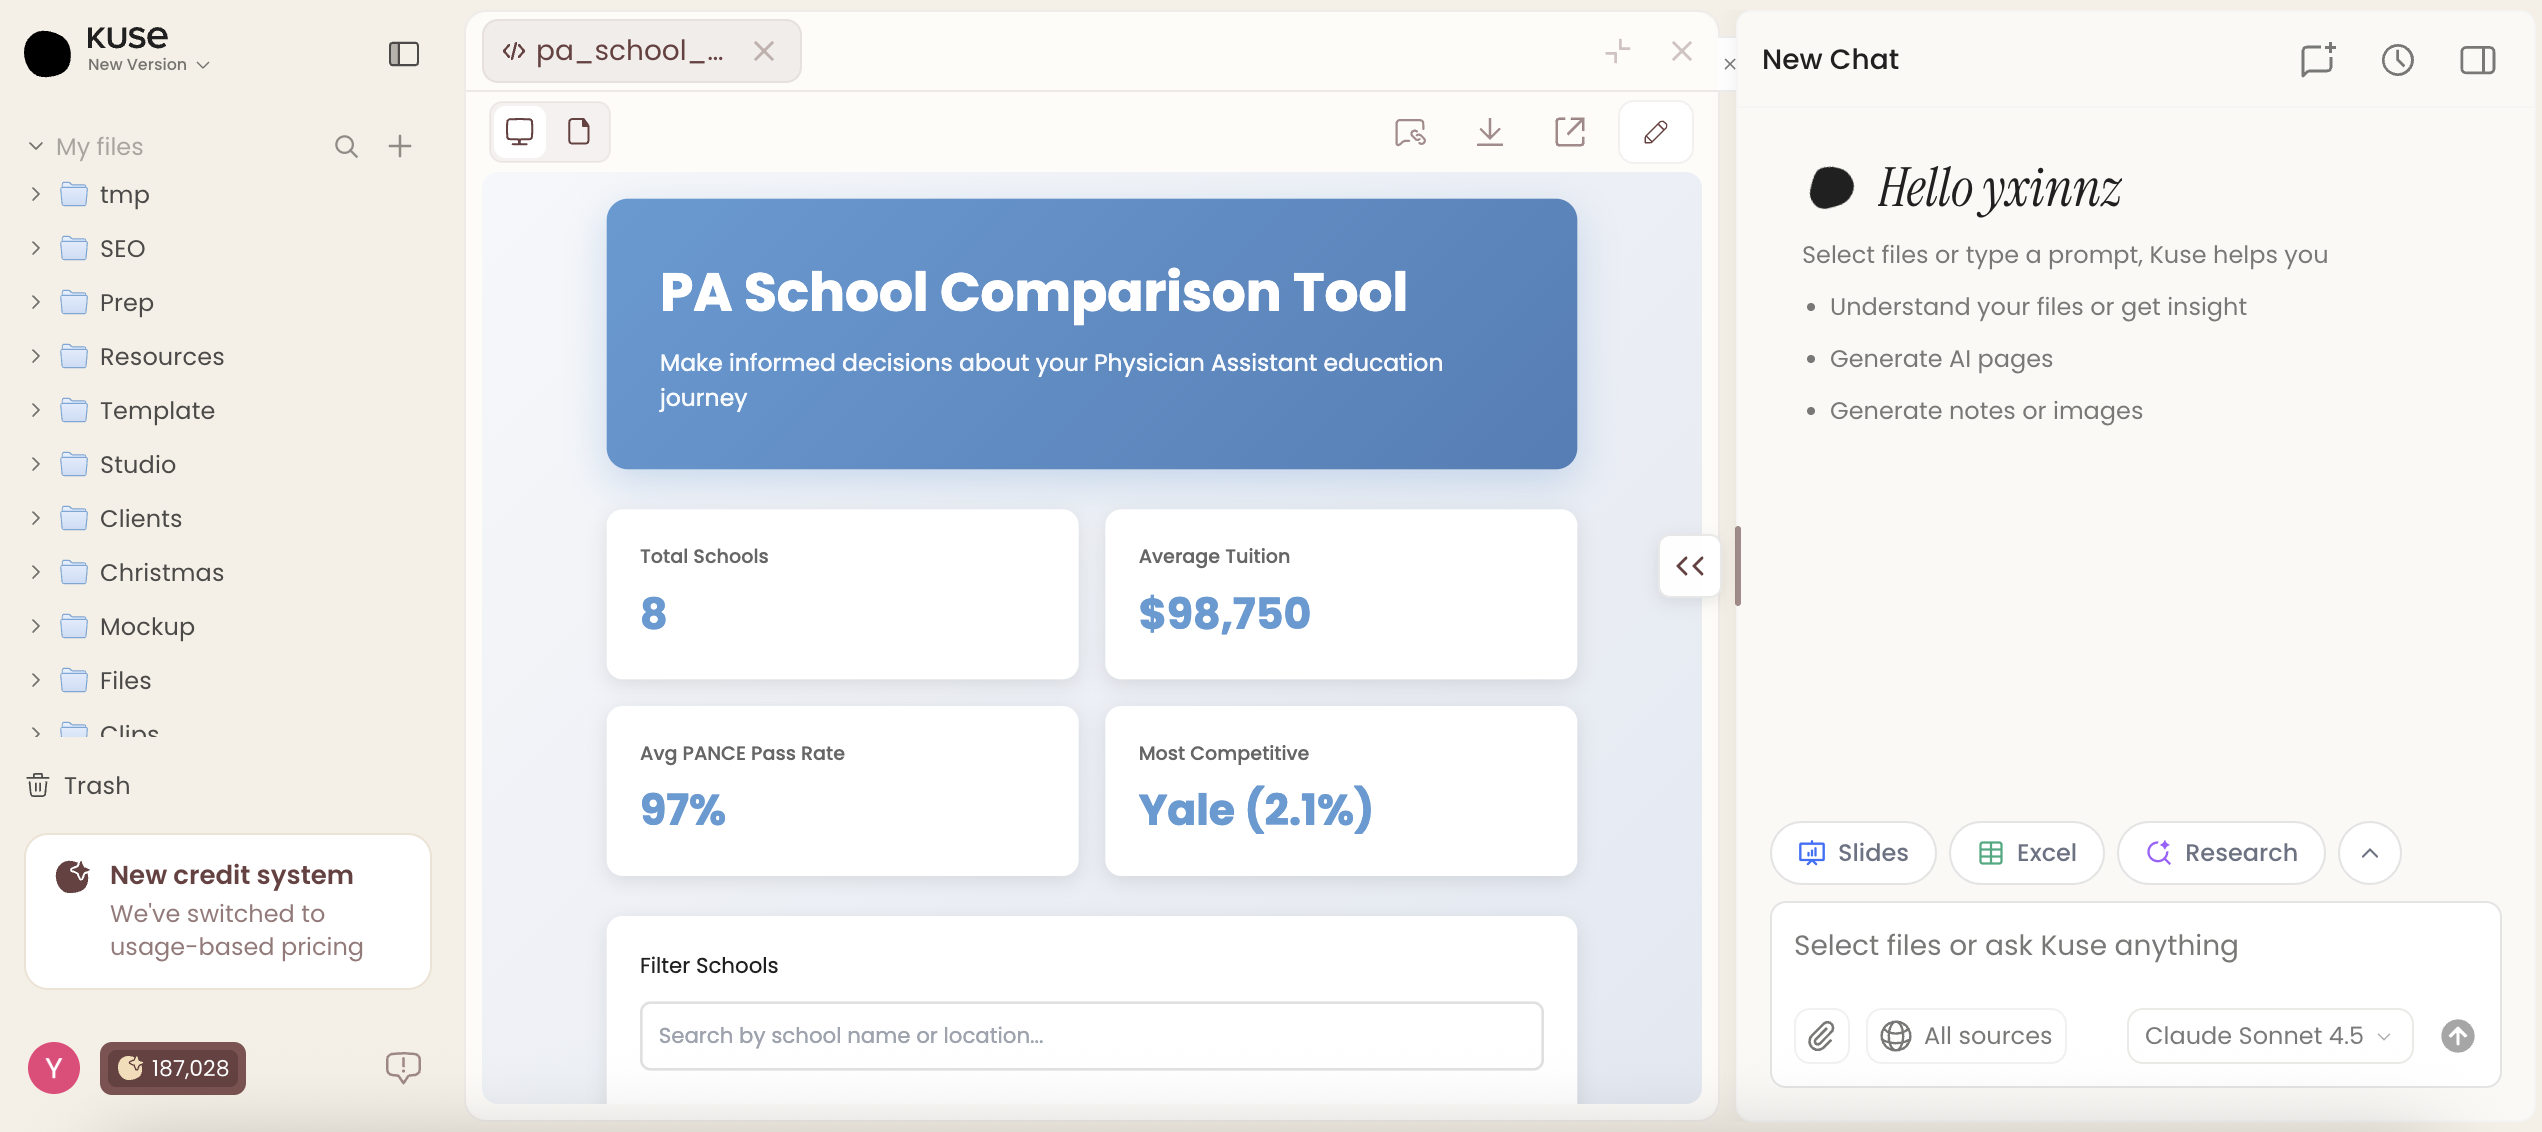
This free income statement template from Kuse goes beyond a static spreadsheet. It presents your financial data as an interactive dashboard, complete with visual breakdowns of revenue streams, cost categories, and profitability metrics. Instead of scrolling through rows of numbers, you get a structured analysis you can explore, share, and act on.
Who Is This Template For?
This income statement template is designed for anyone who needs to review, present, or analyze financial performance without building reports from scratch.
- Small business owners who want a clean overview of quarterly or annual profitability without hiring a CFO
- Finance teams and accountants looking for a ready-made structure to standardize income reporting across periods
- Startup founders preparing financial summaries for investors, board meetings, or internal reviews
- Freelancers and consultants tracking revenue against operating expenses to understand true take-home profit
- Students and educators studying financial statement analysis with a real-world, interactive example
What's Inside This Income Statement Template
This template is structured around the core components of a standard income statement, presented as an interactive dashboard that makes financial data easier to digest.
Revenue Breakdown
The template starts with a detailed view of revenue sources. You can see total revenue alongside individual revenue streams, making it simple to identify which products, services, or business lines are driving the most income. The visual layout highlights revenue composition so you don't need to manually calculate percentages.

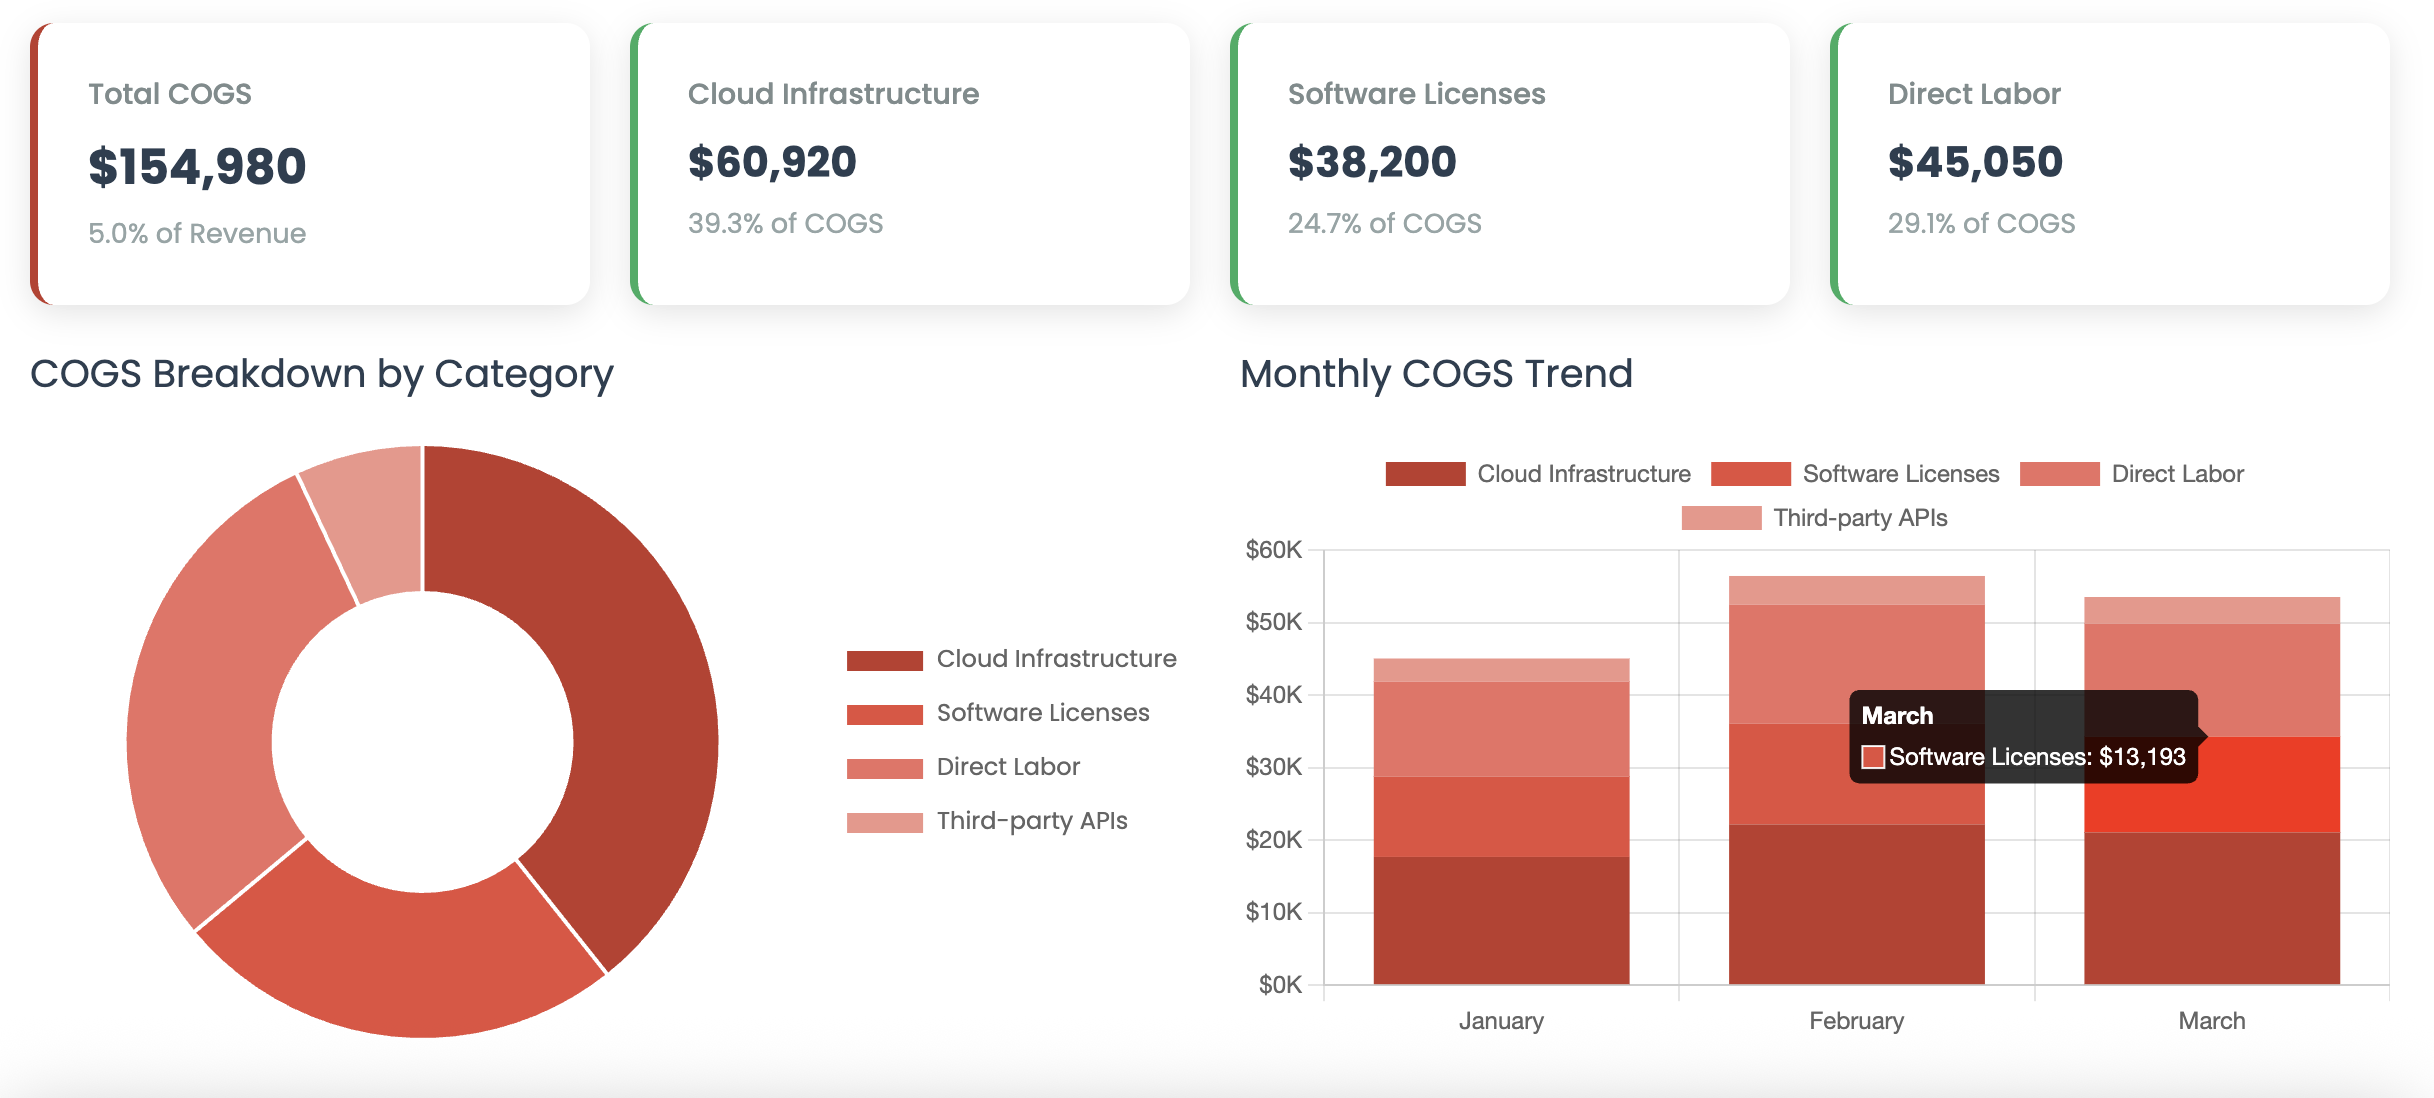
Cost of Goods Sold (COGS)
Below the revenue section, the template tracks cost of goods sold — the direct costs associated with delivering your product or service. This section helps you understand your gross margin at a glance, showing how much revenue remains after covering production or delivery costs.
Gross Profit Analysis
The template automatically surfaces your gross profit by subtracting COGS from total revenue. This metric is essential for evaluating whether your core business operations are financially viable before factoring in overhead and administrative costs.

Operating Expenses
Operating expenses are categorized clearly — from salaries and marketing spend to rent, software subscriptions, and professional services. The dashboard format lets you quickly compare expense categories and spot areas where spending may be disproportionate relative to revenue.

Net Income and Profitability Metrics
At the bottom line, the template calculates net income after all expenses, taxes, and deductions. Key profitability ratios — including gross margin and net profit margin — are presented alongside the raw numbers, giving you a complete picture of financial health in a single view.

Why Use an Interactive Income Statement Instead of a Spreadsheet?
Traditional income statement spreadsheets work, but they come with limitations. Numbers sit in cells. Formulas break. Formatting is inconsistent across teams. And sharing a spreadsheet often means losing control of the version.
An interactive income statement template solves these problems in several ways:
- Visual clarity — Charts and structured layouts make it faster to spot trends, anomalies, and key takeaways
- Shareability — Send a link instead of attaching a file. Stakeholders can view the dashboard without downloading anything
- Consistency — A fixed template structure ensures every reporting period follows the same format, reducing errors and saving prep time
- Presentation-ready — No need to reformat data for board decks or investor meetings. The dashboard is designed to communicate clearly on its own
How to Use This Income Statement Template
Getting started takes just a few steps. The template is designed to be intuitive, even if you have no background in accounting or financial modeling.
Step 1: Open and Explore the Template
Start by reviewing the pre-filled example data. The template uses a sample company's Q1 financials to show you exactly how each section works. Take a few minutes to click through the revenue, expense, and profitability sections to understand the layout.
Step 2: Customize with Your Data
Replace the sample figures with your own revenue and expense data. The template structure guides you through each line item — from top-line revenue down to net income. Add, remove, or rename categories to match your specific business model.
Step 3: Review the Dashboard
Once your data is in place, the interactive dashboard updates to reflect your numbers. Review the visual breakdowns to quickly assess your gross margin, operating efficiency, and bottom-line profitability.
Step 4: Share with Your Team
Use the share feature to send the dashboard to co-founders, investors, accountants, or team leads. Everyone sees the same interactive view — no file compatibility issues, no version confusion.
Key Financial Metrics This Template Tracks
Understanding the numbers is only half the job. Knowing which metrics matter most helps you make better decisions. This template highlights several critical financial indicators:
- Total Revenue — The sum of all income generated from business activities during the period
- Gross Profit — Revenue minus cost of goods sold, showing the profitability of core operations
- Gross Margin (%) — Gross profit as a percentage of revenue, indicating pricing and production efficiency
- Total Operating Expenses — All costs required to run the business beyond direct production costs
- Operating Income — Gross profit minus operating expenses, reflecting earnings from core business activities
- Net Income — The final profit after all expenses, taxes, and deductions are accounted for
- Net Profit Margin (%) — Net income as a percentage of revenue, the ultimate measure of overall profitability
Tips for Getting the Most from Your Income Statement
Compare Across Periods
A single income statement tells you where you stand. Comparing statements across quarters or years tells you where you're heading. Use this template consistently to build a financial history you can analyze for trends.
Watch Your Expense Ratios
Look at each expense category as a percentage of revenue, not just as a raw dollar amount. A marketing budget of $50,000 means something very different at $200,000 in revenue than at $2 million.
Separate Recurring from One-Time Items
If your income statement includes unusual or one-time expenses — like equipment purchases or legal settlements — note them separately. This gives you a cleaner view of ongoing operational performance.
Use It Before Decisions, Not Just After
Don't wait until the end of the quarter to review your income statement. Update it monthly or even weekly during critical periods. The sooner you spot a margin squeeze or revenue shortfall, the faster you can respond.
Get Started with This Free Template
Financial clarity shouldn't require expensive software or hours of spreadsheet work. This free income statement template gives you a professional, interactive dashboard that's ready to use immediately. Whether you're preparing for an investor meeting, reviewing quarterly performance, or simply trying to understand where your money goes, this template provides the structure and visibility you need.
Open the template, plug in your numbers, and start making data-driven financial decisions today.